
1. Introduction
Data analysis remains the heart of research interpretations. For example, in Human Resource (HR) research, where human behavior, motivation, and performance are central concerns, statistical analysis provides the foundation for transforming raw data into meaningful insights. In this line, the credibility of any research outcome largely depends on the type of statistical analysis used. However, the balance between descriptive and inferential approaches is particularly important. Understanding how these two levels of analysis interact helps researchers and practitioners make informed, evidence-based decisions.
2. Descriptive and Inferential Statistics in Research
There are two main levels of statistical analysis in research. These main levels are descriptive and inferential.
Descriptive statistics
They are used to organize, summarize, and present data in a simple, understandable form. They describe what the data reveal about a sample without extending those conclusions beyond the data itself.
Measures such as the mean (x̄), median (M), and mode (Mo) reveal the central tendency of data
Standard deviation (s) and variance (s²) show how widely data points are spread.
Frequencies (f) and percentages (%) are often used to describe the distribution of categorical variables like gender, education level, or job category.
Inferential Statistics
Inferential statistics, on the other hand, allow researchers to go beyond mere description. They enable researchers to make inferences; they enable generalization of findings from a sample (n) to an entire population (N).
Inferential techniques help answer questions about relationships, differences, and predictions. For example, instead of surveying all employees in an organization, an HR researcher may collect data from a representative sample and then use inferential methods to predict the attitudes or behaviors of the entire workforce.
3. Purpose of Inferential Statistics
Inferential statistics serve several important purposes in HR research. They enable researchers to:
1. test hypotheses (H₀ for null hypothesis and H₁ for alternative hypothesis)
2. Compare groups
3. Measure relationships, and
4. Make predictions.
For example, hypothesis testing helps verify assumptions or theories about workforce behavior, while correlation (r) and regression (R²) analyses help measure and predict the strength of relationships between variables.
4. Common Inferential Techniques and Their Use in HR
Several inferential techniques are frequently applied in HR research, each suited to specific analytical needs.
The t-test (t) is used to compare the means of two groups—for instance, comparing average job satisfaction between male and female employees. When there are more than two groups.
Analysis of Variance (ANOVA, F) determines whether differences in means are statistically significant. For example they can be used in comparing motivation levels across departments.
Chi-square test (χ²) is used in categorical data to assess associations between variables, such as marital status and absenteeism.
When exploring relationships between continuous variables:
Correlation analysis (r for Pearson or ρ for Spearman) is used.
Regression analysis (β coefficients and R² values) predicts one variable from another. For example, predicting employee performance from leadership support and training.
5. Assumptions Underlying Inferential Analysis
Inferential techniques rest on several assumptions that ensure validity of results. Some of these assumptions are:
1. The sample should be representative of the population.
2. Data should follow a normal distribution
3. There should be homogeneity of variance (equal variances across groups).
4. Observations must also be independent.
When these assumptions can not be met or are violated, non-parametric tests will apply. They include:
1. The Mann–Whitney U test or
2. Kruskal–Wallis test (H)
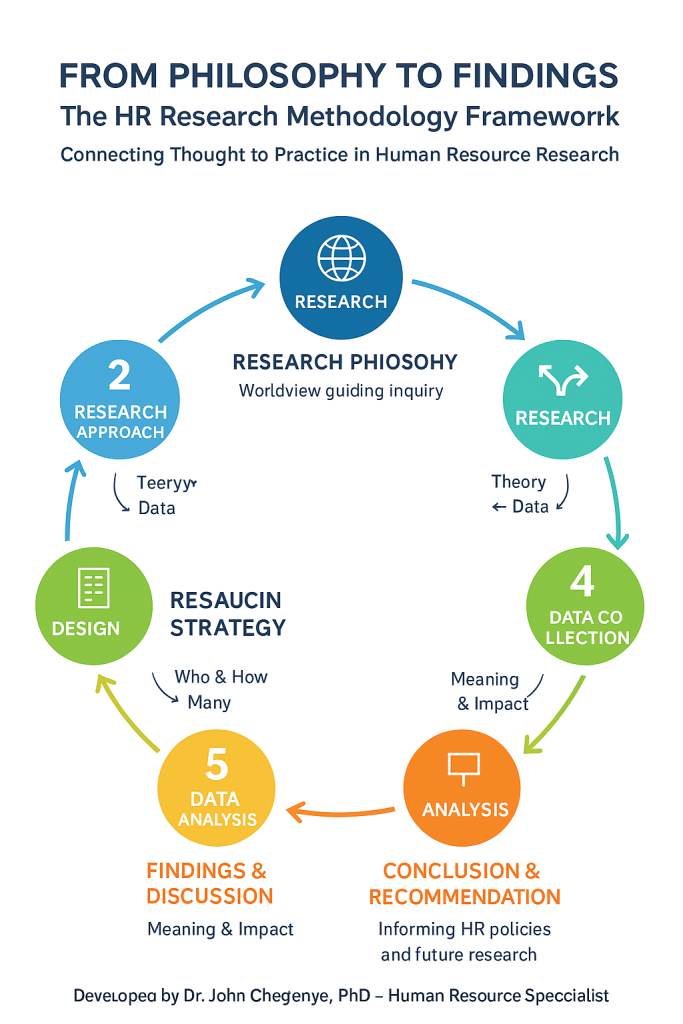
6. The Circular Flow of Inferential Statistics
The process of inferential analysis follows a circular research flow. It begins with hypothesis formulation (H₀ and H₁), followed by data sampling (n), statistical testing (t, F, χ², r, β), interpretation of results (p-values and significance levels, α), and decision-making based on findings. This cyclical process ensures that each decision made from statistical evidence informs new questions, promoting continuous improvement in research and practice.
7. Importance of Inferential Statistics in HR Research
Inferential statistics are invaluable because
1. They bridge data and decision-making.
2. They allow researchers to move from observation to explanation and prediction.
Through inferential methods, HR professionals can identify significant patterns and use them to inform strategic choices in recruitment, training, motivation, and retention. For instance, regression analysis showing a strong β coefficient between leadership support and engagement would justify investment in leadership development programs. Similarly, ANOVA results (F-values with p < 0.05) may reveal departments needing targeted interventions.
8. Conclusion
Data analysis is more than a step in the research process—it is the engine of discovery. Descriptive and inferential statistics work together to transform HR data into insights. Descriptive statistics (x̄, s, %) provide clarity, while inferential statistics (t, F, χ², r, β, p) provide depth and guidance for decision-making. Together, they empower HR researchers and practitioners to move confidently from data to decision, linking empirical findings to effective human resource strategies.
Author Bio
Dr. John Chegenye is a Human Resource Management scholar, educator, and consultant specializing in organizational behavior, labor relations, and performance management. He writes on leadership, labor policy, and institutional development.

Leave a comment